Sales Vs. Wages
Logging your incoming sales or gross profit (GP) and comparing it to your outgoing wages can be a fantastic way to achieve a properly forecasted roster, actively track sales for reports, and find discrepancies between your projections and what actually happened that week/fortnight.
To aid in ensuring full visibility of your data, you can also highlight when a wage percentage exceeds a certain amount, and even the option to track per department.
This information is different to Budgets but equally as beneficial, and will be coming soon in a future article.
You can also grab the Sales vs. Wages data from Reports for previous roster/pay periods, which can be exported into Excel.
To get the best out of the Sales vs. Wages report, Projected Sales/GP data must be entered; this can be completed as you're creating the roster, or can be backdated.
Actual Sales/GP data is manually entered either in the timesheet or backdated in the roster for the same period. If you're lucky enough and use one of the Point of Sale systems that we integrate with, we may be able to pull your data automatically.
Before we get to the fancy stuff, let's enable the tool and have a look at the difference between Sales and Gross Profit, and how Sales vs. Wages works.
Difference between Sales and Gross Profit
Sales is incoming revenue stream into the business, based off selling your goods and services.
Gross profit is the incoming revenue stream minus production/manufacturing costs and any overheads.
Depending on which you would prefer tracking, it can change the wage percentage and calculations for this tool and report.
Enabling Sales/GP Tracking
- Open up Wageloch and sign in.
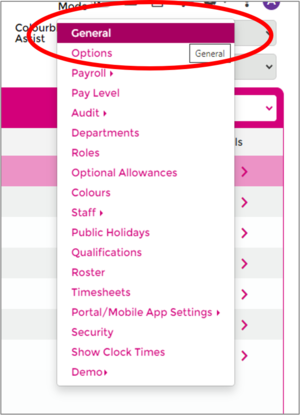
- Click on the Settings cog in the top right and select General.
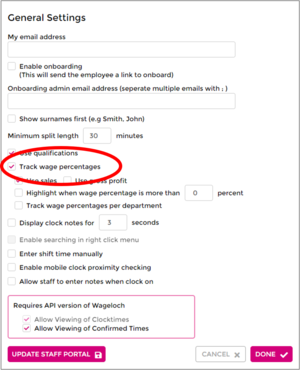
- Tick the box for Track wage percentages
- Choose to track by Sales or Gross Profit.
- Opt for highlighting % or if you'd like to track per department.
- Click Done to save.
How does it work?
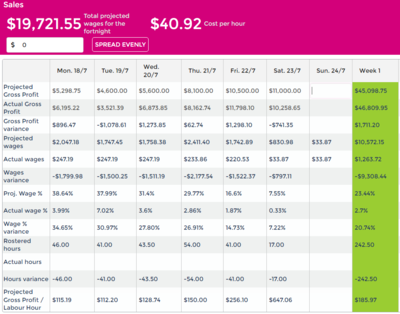
When creating your roster and inputting data in the Sales area, the only two fields you can enter values into are the Projected Sales/GP and the Actual Sales/GP.
Ideally when in the setup stages, only input the Projected Sales/GP values; if you're backdating data, you can input the Actual Sales/GP values.
To generate the wage percentage and reports correctly, the calculations work off four (4) fields:
- Projected Sales or Gross Profit
- Actual Sales or Gross Profit
- Projected Wages (based off the rostered hours)
- Actual Wages (based off the timesheet)
When viewing your Wage Percentage, for most industries anything sitting around 20% - 25% is average and ideal; the lower the better.
If you're finding your wage percentage is creeping up and over 30%, you may need to review your revenue or your rosters to be more cost effective.
| Figures to include for accurate data: |
|---|
|
| Value 1 | Value 2 | Result | Notes |
|---|---|---|---|
| Projected Sales/GP | Actual Sales/GP | Sales/GP Variance | Are you up, down or break even? |
| Projected Wages | Actual Wages | Wages Variance | Did you spend more/less on wages than you earned? |
| Projected Wage % | Actual Wage % | Wage Percentage Variance | What is the variance between the % of money you spent on wages? |
| Roster Hours | Actual Paid Hours | Hours Variance | Was there a difference between your roster and timesheet hours? |
| Projected Sales/GP | Projected Wages | Projected Wage % | How much of your Sales/GP will you anticipate spending on wages? |
| Actual Sales/GP | Actual Wages | Actual Wage % | How much of your Sales /GP have you spent on Wages? |
Format: Roster vs Report
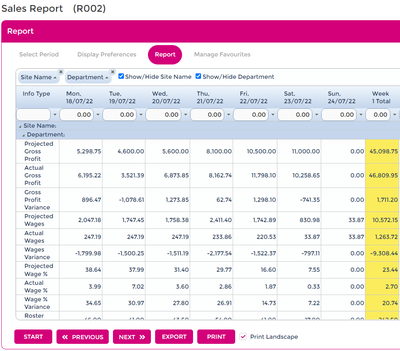
When looking at the difference between the two report formats, one key difference is that when running the Sales vs Wages report from the Reports menu, this is able to be exported as a .csv or .xlsx spreadsheet format to work with in programs such as Microsoft Excel or even Google Sheets.
Click on the thumbnails to open a larger view of the images.


